

Acerca de este curso
Compártelo


- Data Modeling and Transformation
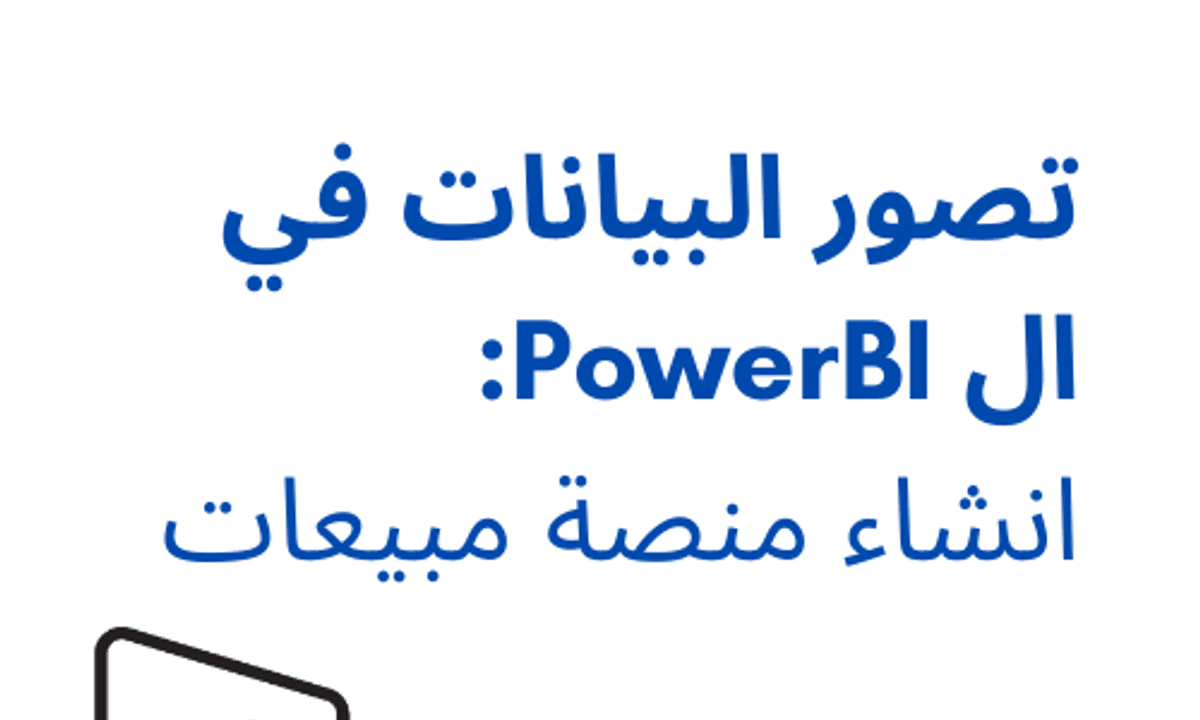
- In this module, you will explore the world of business intelligence and derive stories from data and present them to a targeted audience. You will also learn to identify and implement transformations in data for visualization with Power BI Desktop.
- Data Analysis Expression (DAX)
- In this module, you will learn to manipulate data with DAX formulas to create measures and columns, operate these transformations with the help of DAX functions, and create relationships to manage data.
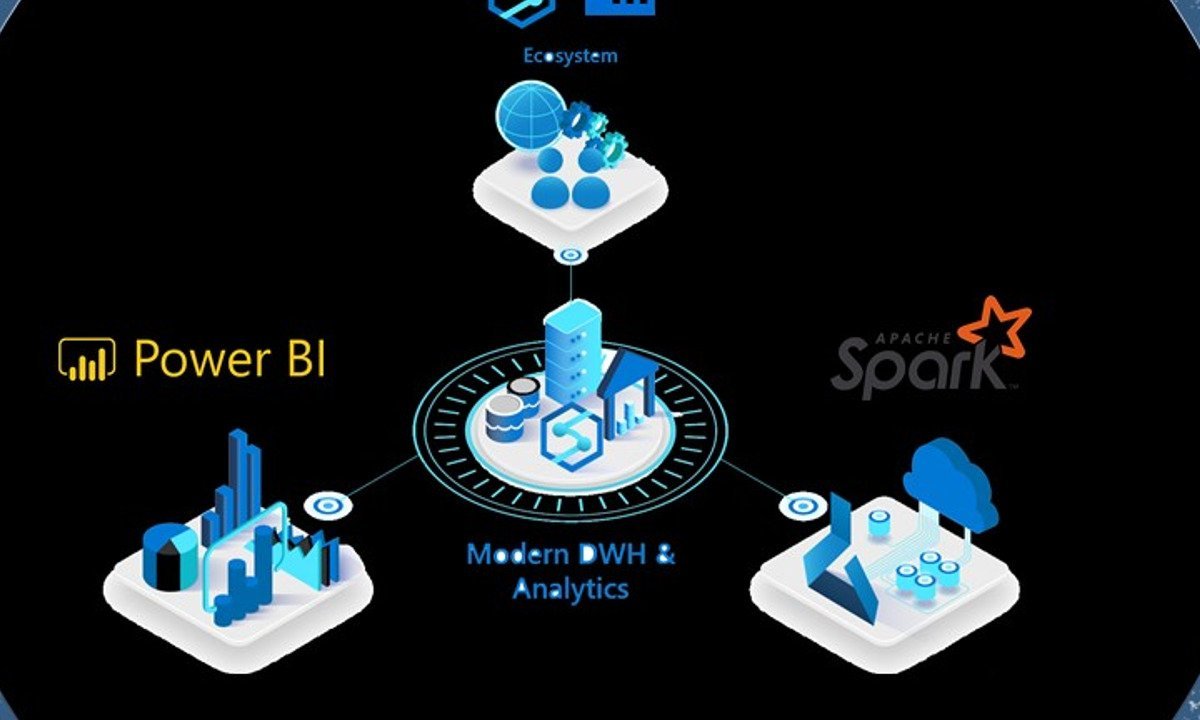
- Data Visualization
- In this module, you will learn to create data visuals with the help of common charts and custom visuals and understand how they work. We will also learn about the best practices that are to be followed while building paginated reports and dashboards.
- Power BI Service
- In this module, you will learn about Power BI Service, make use of the features after publishing reports and dashboards on the Service interface, manage Smart Narrative, use Q & A to draw more insights from data, secure reports and dashboards with security roles, and observe data lineage.
- Course Wrap Up and Assessment
- This module is designed to assess an individual on the various concepts and teachings covered in this course. Answer a comprehensive quiz which marks you as a learner who is confident in working with Power BI.
Cursos relacionados


GRATIS Aprendiendo a aprender: Poderosas herramientas mentales…

Deep teaching solutions

Español
GRATIS Programación para todos (Introducción a Python)
University of Michigan
Inglés

GRATIS The Science of Well-Being
Yale
Inglés

GRATIS Negociación exitosa: Estrategias y habilidades esenciales
University of Michigan
Inglés

GRATIS Primeros Auxilios Psicológicos (PAP)
Universitat Autónoma de Barcelona
Español

GRATIS Chino para principiantes
Peking University
Inglés
¿Te apetece valorar
nuestra web?
4.3 / 5 ( 3432 votos )
¿Preparado para tu próximo proyecto laboral?
Copyright © 2022 Mooc. Todos los derechos reservados